P2P
[3]:
%matplotlib inline
import numpy as np
import pandas as pd
import matplotlib.pyplot as plt
import networkx as nx
import pymarket as pm
Creates new market
[4]:
r = np.random.RandomState(1234)
mar = pm.Market()
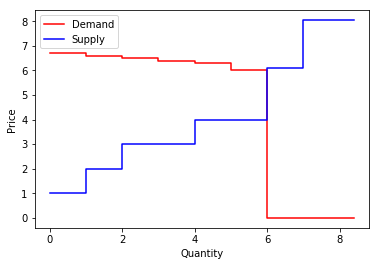
mar.accept_bid(1, 6.7, 0, True, 0)
mar.accept_bid(1, 6.6, 1, True, 0)
mar.accept_bid(1, 6.5, 2, True, 0)
mar.accept_bid(1, 6.4, 3, True, 0)
mar.accept_bid(1, 6.3, 4, True, 0)
mar.accept_bid(1, 6, 5, True, 0)
mar.accept_bid(1, 1, 6, False, 0)
mar.accept_bid(1, 2, 7, False, 0)
mar.accept_bid(2, 3, 8, False, 0)
mar.accept_bid(2, 4, 9, False, 0)
mar.accept_bid(1, 6.1, 10, False, 0)
bids = mar.bm.get_df()
transactions, extras = mar.run('p2p', r=r)
stats = mar.statistics()
[5]:
bids # bids dataframe
[5]:
| quantity | price | user | buying | time | divisible | |
|---|---|---|---|---|---|---|
| 0 | 1 | 6.7 | 0 | True | 0 | True |
| 1 | 1 | 6.6 | 1 | True | 0 | True |
| 2 | 1 | 6.5 | 2 | True | 0 | True |
| 3 | 1 | 6.4 | 3 | True | 0 | True |
| 4 | 1 | 6.3 | 4 | True | 0 | True |
| 5 | 1 | 6.0 | 5 | True | 0 | True |
| 6 | 1 | 1.0 | 6 | False | 0 | True |
| 7 | 1 | 2.0 | 7 | False | 0 | True |
| 8 | 2 | 3.0 | 8 | False | 0 | True |
| 9 | 2 | 4.0 | 9 | False | 0 | True |
| 10 | 1 | 6.1 | 10 | False | 0 | True |
[6]:
transactions.get_df() # transactions dataframe
[6]:
| bid | quantity | price | source | active | |
|---|---|---|---|---|---|
| 0 | 3 | 1 | 3.70 | 6 | False |
| 1 | 6 | 1 | 3.70 | 3 | False |
| 2 | 5 | 0 | 0.00 | 10 | True |
| 3 | 10 | 0 | 0.00 | 5 | True |
| 4 | 2 | 1 | 4.25 | 7 | False |
| 5 | 7 | 1 | 4.25 | 2 | False |
| 6 | 4 | 1 | 5.15 | 9 | False |
| 7 | 9 | 1 | 5.15 | 4 | True |
| 8 | 0 | 1 | 4.85 | 8 | False |
| 9 | 8 | 1 | 4.85 | 0 | True |
| 10 | 5 | 1 | 5.00 | 9 | False |
| 11 | 9 | 1 | 5.00 | 5 | False |
| 12 | 1 | 1 | 4.80 | 8 | False |
| 13 | 8 | 1 | 4.80 | 1 | False |
[7]:
extras # additional information characteristic of P2P trading
[7]:
{'trading_list': [[(3, 6), (5, 10), (2, 7), (4, 9), (0, 8)], [(5, 9), (1, 8)]]}
Trades among participants
[9]:
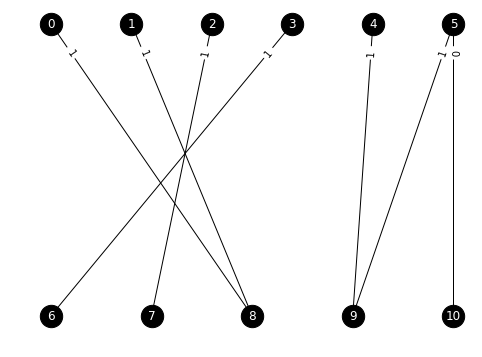
ax = mar.plot_method('p2p')
/home/guso/anaconda3/lib/python3.6/site-packages/networkx/drawing/nx_pylab.py:611: MatplotlibDeprecationWarning: isinstance(..., numbers.Number)
  if cb.is_numlike(alpha):
Analysis of the results
Round 1
- 3 trades with 6, they both trade all their quantity and are not considered for next round
- 5 trades with 10, the asked price by 10 is to high and no trade happens, they continue in next round
- 2 trades with 7, they both trade all their quantity and are not considered for next round
- 4 trades with 9, they trade one unit and 9 goes to next one with one remaining unit
- 0 trades with 8, they trade one unit and 8 goes to next one with one remaining unit
- 1 is not paired with anyone and continues to round 2
Round 2
- 5 trades with 9, they both trade all their remaining quantity and are not considered for the next round
- 1 trades with 8, they both trade all their remaining quantity and are not considered for the next round
- 10 is not paired and continues to the round 3
Round 3
- Only 10 remains, so no trade can ocurr, the algorithm ends.
Statistics
[10]:
print('Percentage of the maximum possible traded quantity')
stats['percentage_traded']
Percentage of the maximum possible traded quantity
[10]:
0.9999999999989999
[11]:
print('Percentage of the maximum possible total welfare')
stats['percentage_welfare']
Percentage of the maximum possible total welfare
[11]:
1.0
[12]:
print('Profits per user')
for u in bids.user.unique():
    print(f'User {u:2} obtained a profit of {stats["profits"]["player_bid"][u]:0.2f}')
Profits per user
User  0 obtained a profit of 1.85
User  1 obtained a profit of 1.80
User  2 obtained a profit of 2.25
User  3 obtained a profit of 2.70
User  4 obtained a profit of 1.15
User  5 obtained a profit of 1.00
User  6 obtained a profit of 2.70
User  7 obtained a profit of 2.25
User  8 obtained a profit of 3.65
User  9 obtained a profit of 2.15
User 10 obtained a profit of 0.00
[13]:
print(f'Profit to Market Maker was {stats["profits"]["market"]:0.2f}')
Profit to Market Maker was 0.00